Valuation Path
Outcomes: Gain an understanding of the Valuation Path tool.
All the scenarios as described and discussed in this manual generally occurs during a Financial Year and it will result in movements on the financial values.
To view these movements there is a new tool in myData - 'Valuation Path'.
1: Select Asset
Select the asset which has been capitalised or select the asset where there are data corrections (resulting in financial changes) and click  icon on the menu bar in myData.

2: Select Asset Component
After launching the 'Valuation Path' for an asset following screen will appear.
Select the asset component for which you want to see the movements.
User can also select the FY from the 'Select Financial Year' to view previous year movements.
The actual chart can be copied into any document by clicking on 'Copy Chart to Clipboard' and the underlying data can be exported by using 'Export To' button.
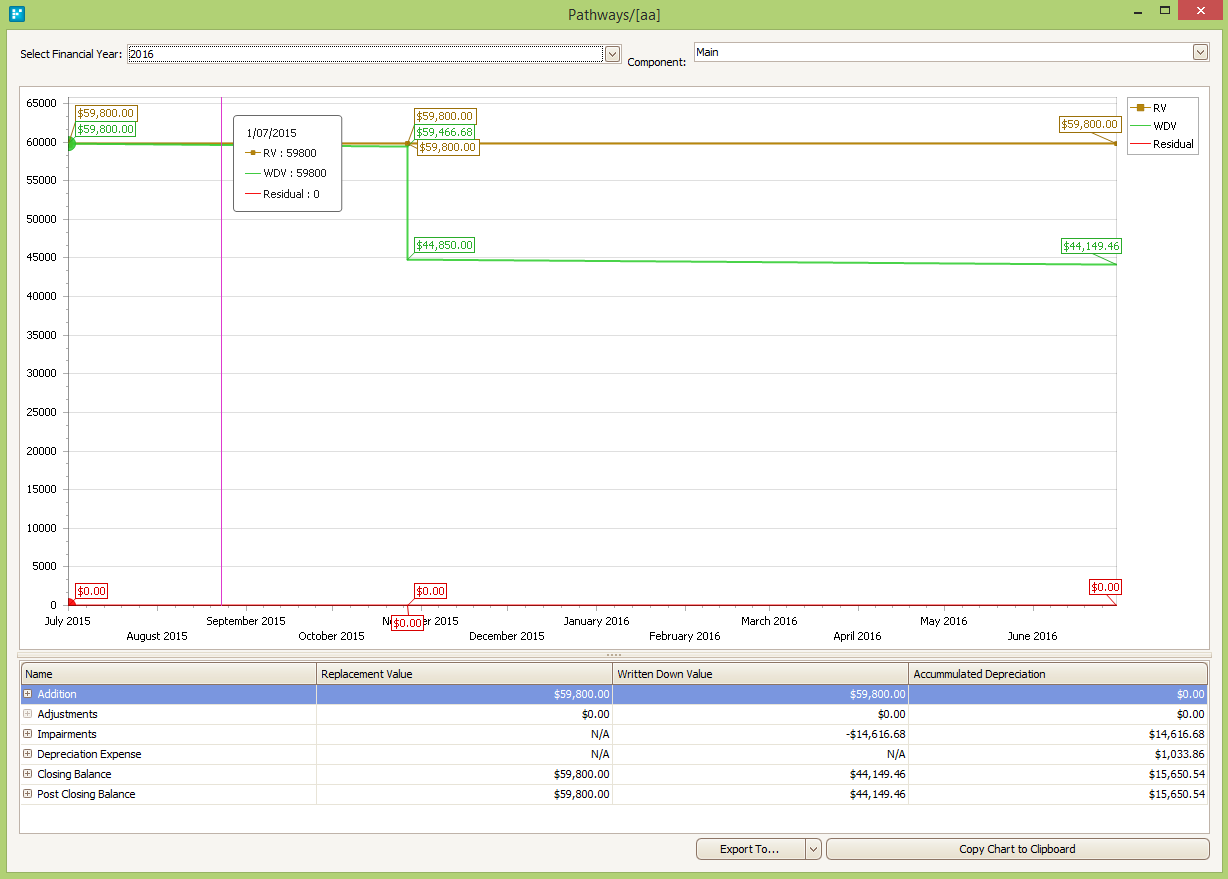
The details of each transaction and related financial values can be viewed by expanding the boxes in the lower sectionof the same screen.
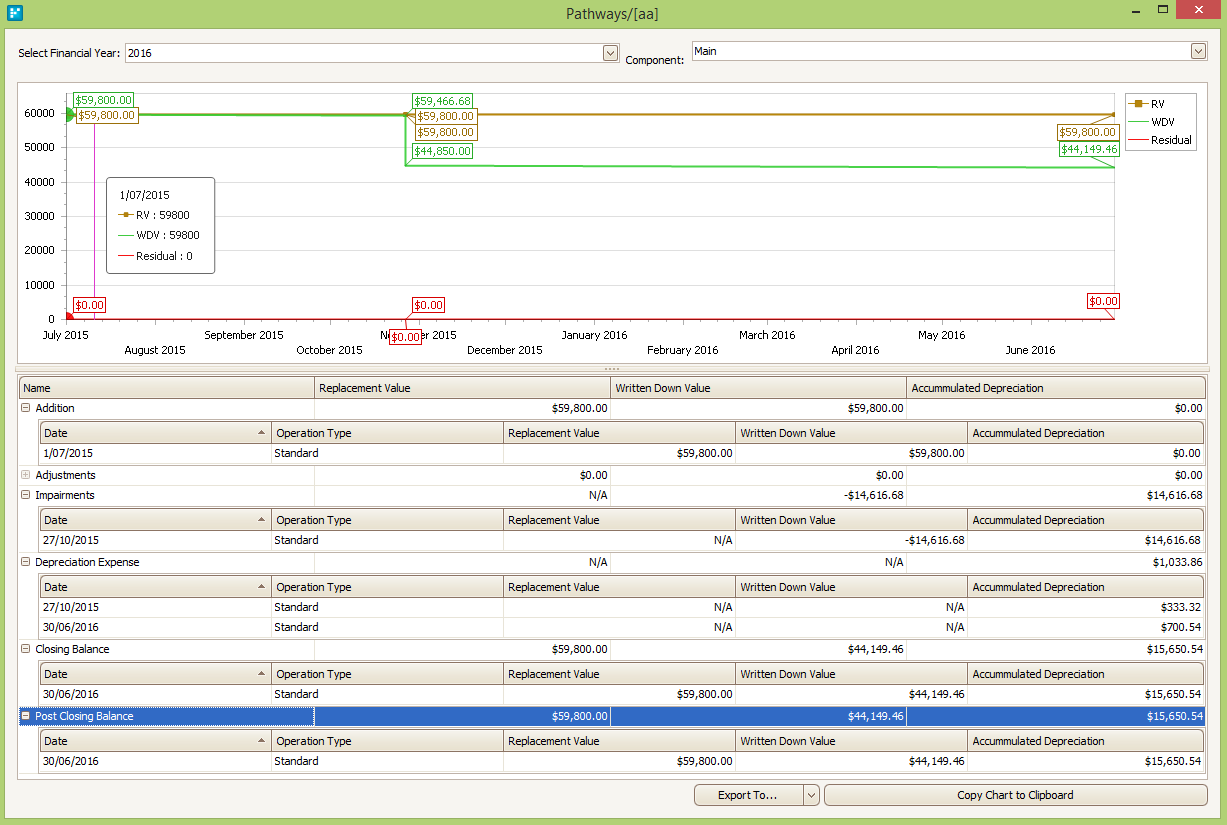
NOTE:- This tool can only be used to view the detail of one asset and/or one single component of that asset at a given time.
